
2021
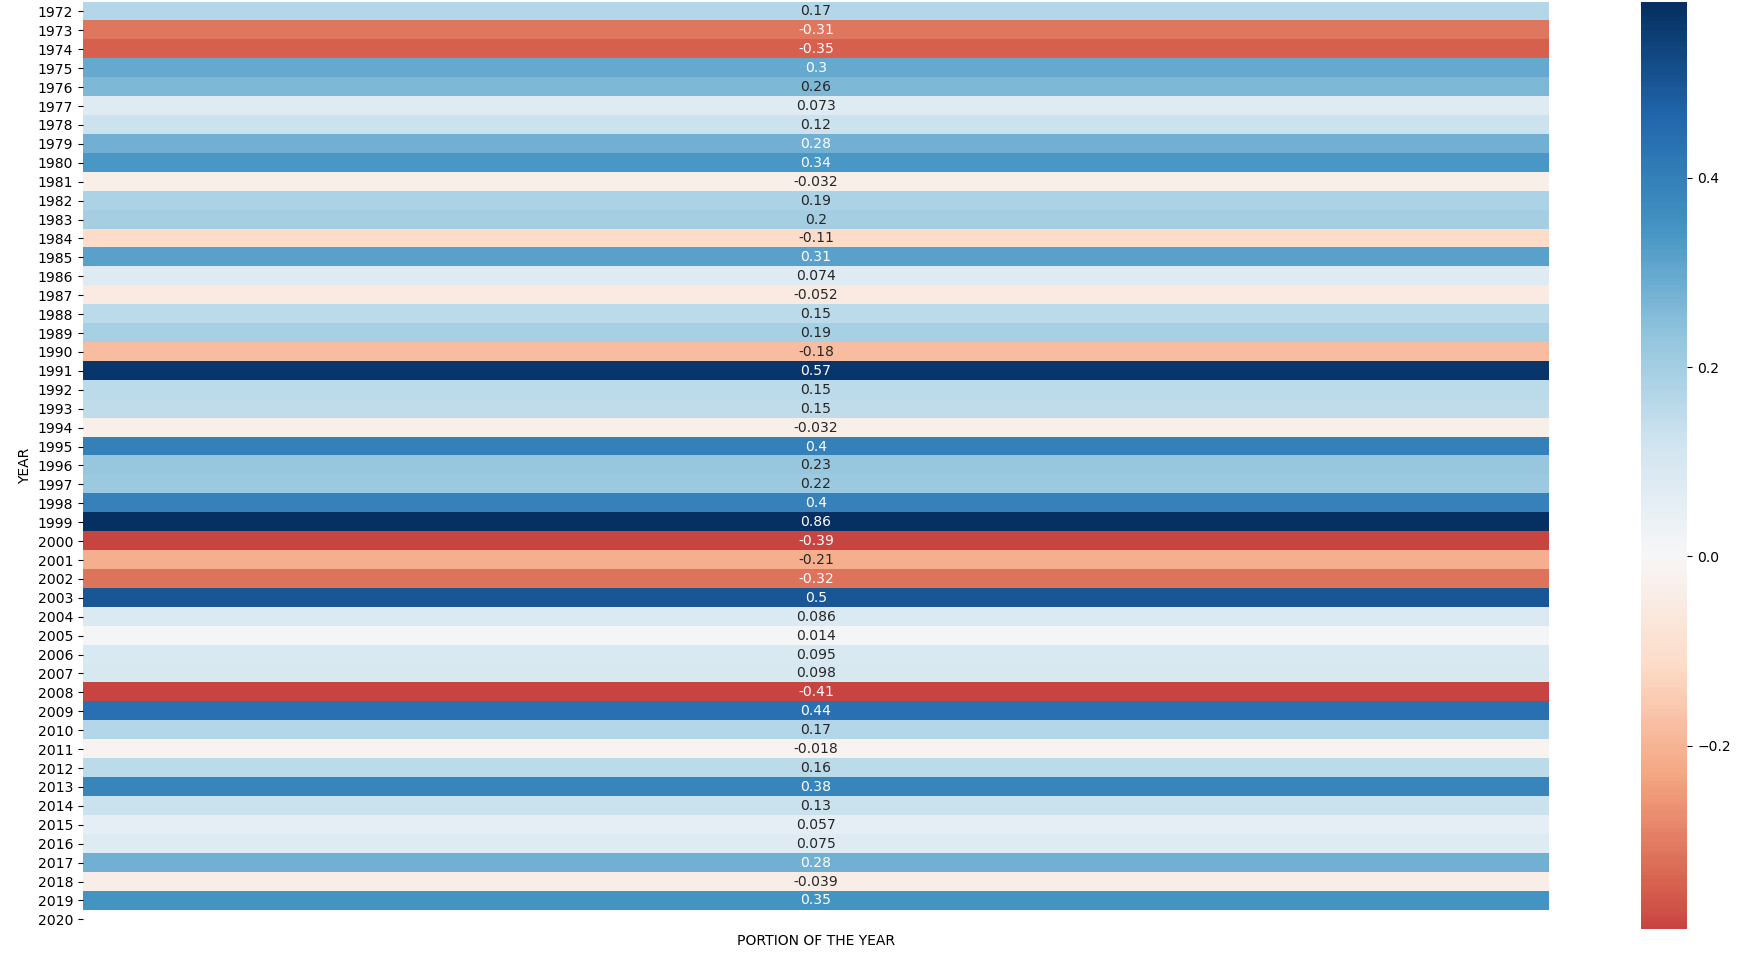
If you look at the NASDAQ’s performance in yearly chunks you’d get something like this.
As you may know, 2020, despite the ‘Rona, has been a breakout year with its yearly growth set to be around 30–40% (it began the year at $8972.60 and as of the date of this article, it stands at $12,658.19, a gain of about 41%).
That would make it two consecutive years of 30+% growth for the NASDAQ.
Here are the years where the year two years previous was above 30%:

There were not that many to choose from, and still, there was only one year where its two previous years were both 30+%: the year 2000.
Don’t let this alarm you however, the prediction accuracy of basing a prediction on the previous two years’ directional signage (whether a year of positive or negative growth) is not very accurate, to say the least. At best a lookback of 2 years on the NASDAQ on whether those 2 years were positive or negative returned a predictive accuracy of 60.46 %, at the sample size wasn’t very large (n=43). On the other hand, I have yet to run simulations on the predictive power of using absolute figures instead of positives and negatives.
The samples for the year 2000 are markedly different than ours. There, 1998 and 1999 had gains of 39.6% and 85.6% respectively, while in our case it is about 35.2% and 41% and counting, hardly comparable. But if we do limit our view to the chart above, it still says (even if we were to give this predictive credence, which we should not) 2021 could range from -40% to +22%, an average of -0.6%.
Again, this should not be given any credence. If we limited our view to the two previous years being both positive in gains, the predictive power of this method is around 60% and you’d have a bigger sample size:

Even out of these samples, the range of possibilities would span the gamut of NASDAQ’s entire history of yearly growth (-40% to 86%), with an average of 8%.
What if the two previous year method was incorrect still, and we simply just looked at the previous year alone (a method whose predictive accuracy is 65%):

The range is the same before but the average is now 11.1%.
If we further limited our view to previous years whose growth was both positive and ≥ 30%, it’d be an even rosier picture:

The range this time skews to the positive side: -39.2% to +85.5%, with an overall average of 14.2%.
If you like my content please follow me on all my socials. And if you feel especially ambitious, support me by becoming a patron. It’d really mean a lot.
WARNING: By using or reading my content in any way, you acknowledge and agree to the following: I am not a registered investment adviser nor am I licensed or qualified to provide investment advice. My content is for informational purposes only and is not advice (financial, investment, or otherwise). You should never invest based solely on my content. You should assume my content is not trustworthy unless verified by your own independent research. None of my content is a guarantee that you will make a profit if you use my content. By reading or using my content in any way, you do so entirely at your own risk. I am not nor shall I be liable to you for any damages or losses you incur directly or indirectly as a result of or arising from the use of my content.
